 |
 |
« geri |
|
Hərəkətin izahı və ölçülməsi (yuxarı) |
|||||||||||||||||||||||||||||||||||||||||||||||||||||||
|
Orta sürət | Məsafə-vaxt qrafiki | Tezlik-vaxt qrafiki | Təcil və Tormozlama |
|||||||||||||||||||||||||||||||||||||||||||||||||||||||
| Orta sürət İstənilən gedişdə nəqliyyat vasitəsinin sürəti dəyişkən olacaq, amma onun orta sürəti götürülmüş ümumi məsafə və vaxt bilindikdə hesablana bilər.
Beləliklə, velosipedçi dəqiqədə (60 saniyə) 600 metr hərəkət edirsə, onun orta sürəti:
|
|||||||||||||||||||||||||||||||||||||||||||||||||||||||
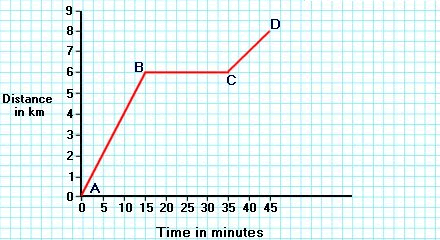
| Məsafə-vaxt qrafiki Obyekt düz xətt üzrə hərəkət edirsə, onun müəyyən nöqtədən məsafəsi məsafə-vaxt qrafiki kimi göstərilə bilər. . |
|||||||||||||||||||||||||||||||||||||||||||||||||||||||
 |
|||||||||||||||||||||||||||||||||||||||||||||||||||||||
|
The steeper the slope of the graph, the greater the speed it represents. The distance stays at 6 km from where the car set off. |
|||||||||||||||||||||||||||||||||||||||||||||||||||||||
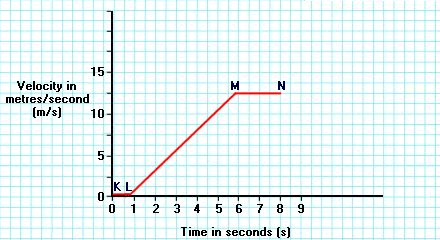
| Velocity–time Graph Velocity is speed in a given direction. Velocity-time graphs can represent the movement of an object. |
|||||||||||||||||||||||||||||||||||||||||||||||||||||||
 |
|||||||||||||||||||||||||||||||||||||||||||||||||||||||
|
The steeper the slope of the line, the greater the acceleration.
So the car covered 31.25 m whilst accelerating.
|
|||||||||||||||||||||||||||||||||||||||||||||||||||||||
| Acceleration and Deceleration Acceleration is the rate at which the velocity of an object changes. This equation is used to calculate the steady acceleration of an object, travelling in a straight line.
If a car accelerates from a velocity of 10 m/s to 50 m/s in 5 seconds its acceleration will be:
The rate that an object's velocity decreases is called its deceleration. It is calculated using the same equation. If a car is travelling at 20 m/s and it comes to a halt in 5s, its deceleration is:
|
|||||||||||||||||||||||||||||||||||||||||||||||||||||||
| Copyright ©2015 Edumedia LLC | |
| skoool haqqında Tərəfdaşlar haqqında Toxunulmazlıq və Təhlükəsizlik | |
| EDUMEDIA şirkəti tərəfindən adaptasiya olunub. |
 |